DATA VISUALIZATION
NET ZERO COMPASS
JUNE, 2023
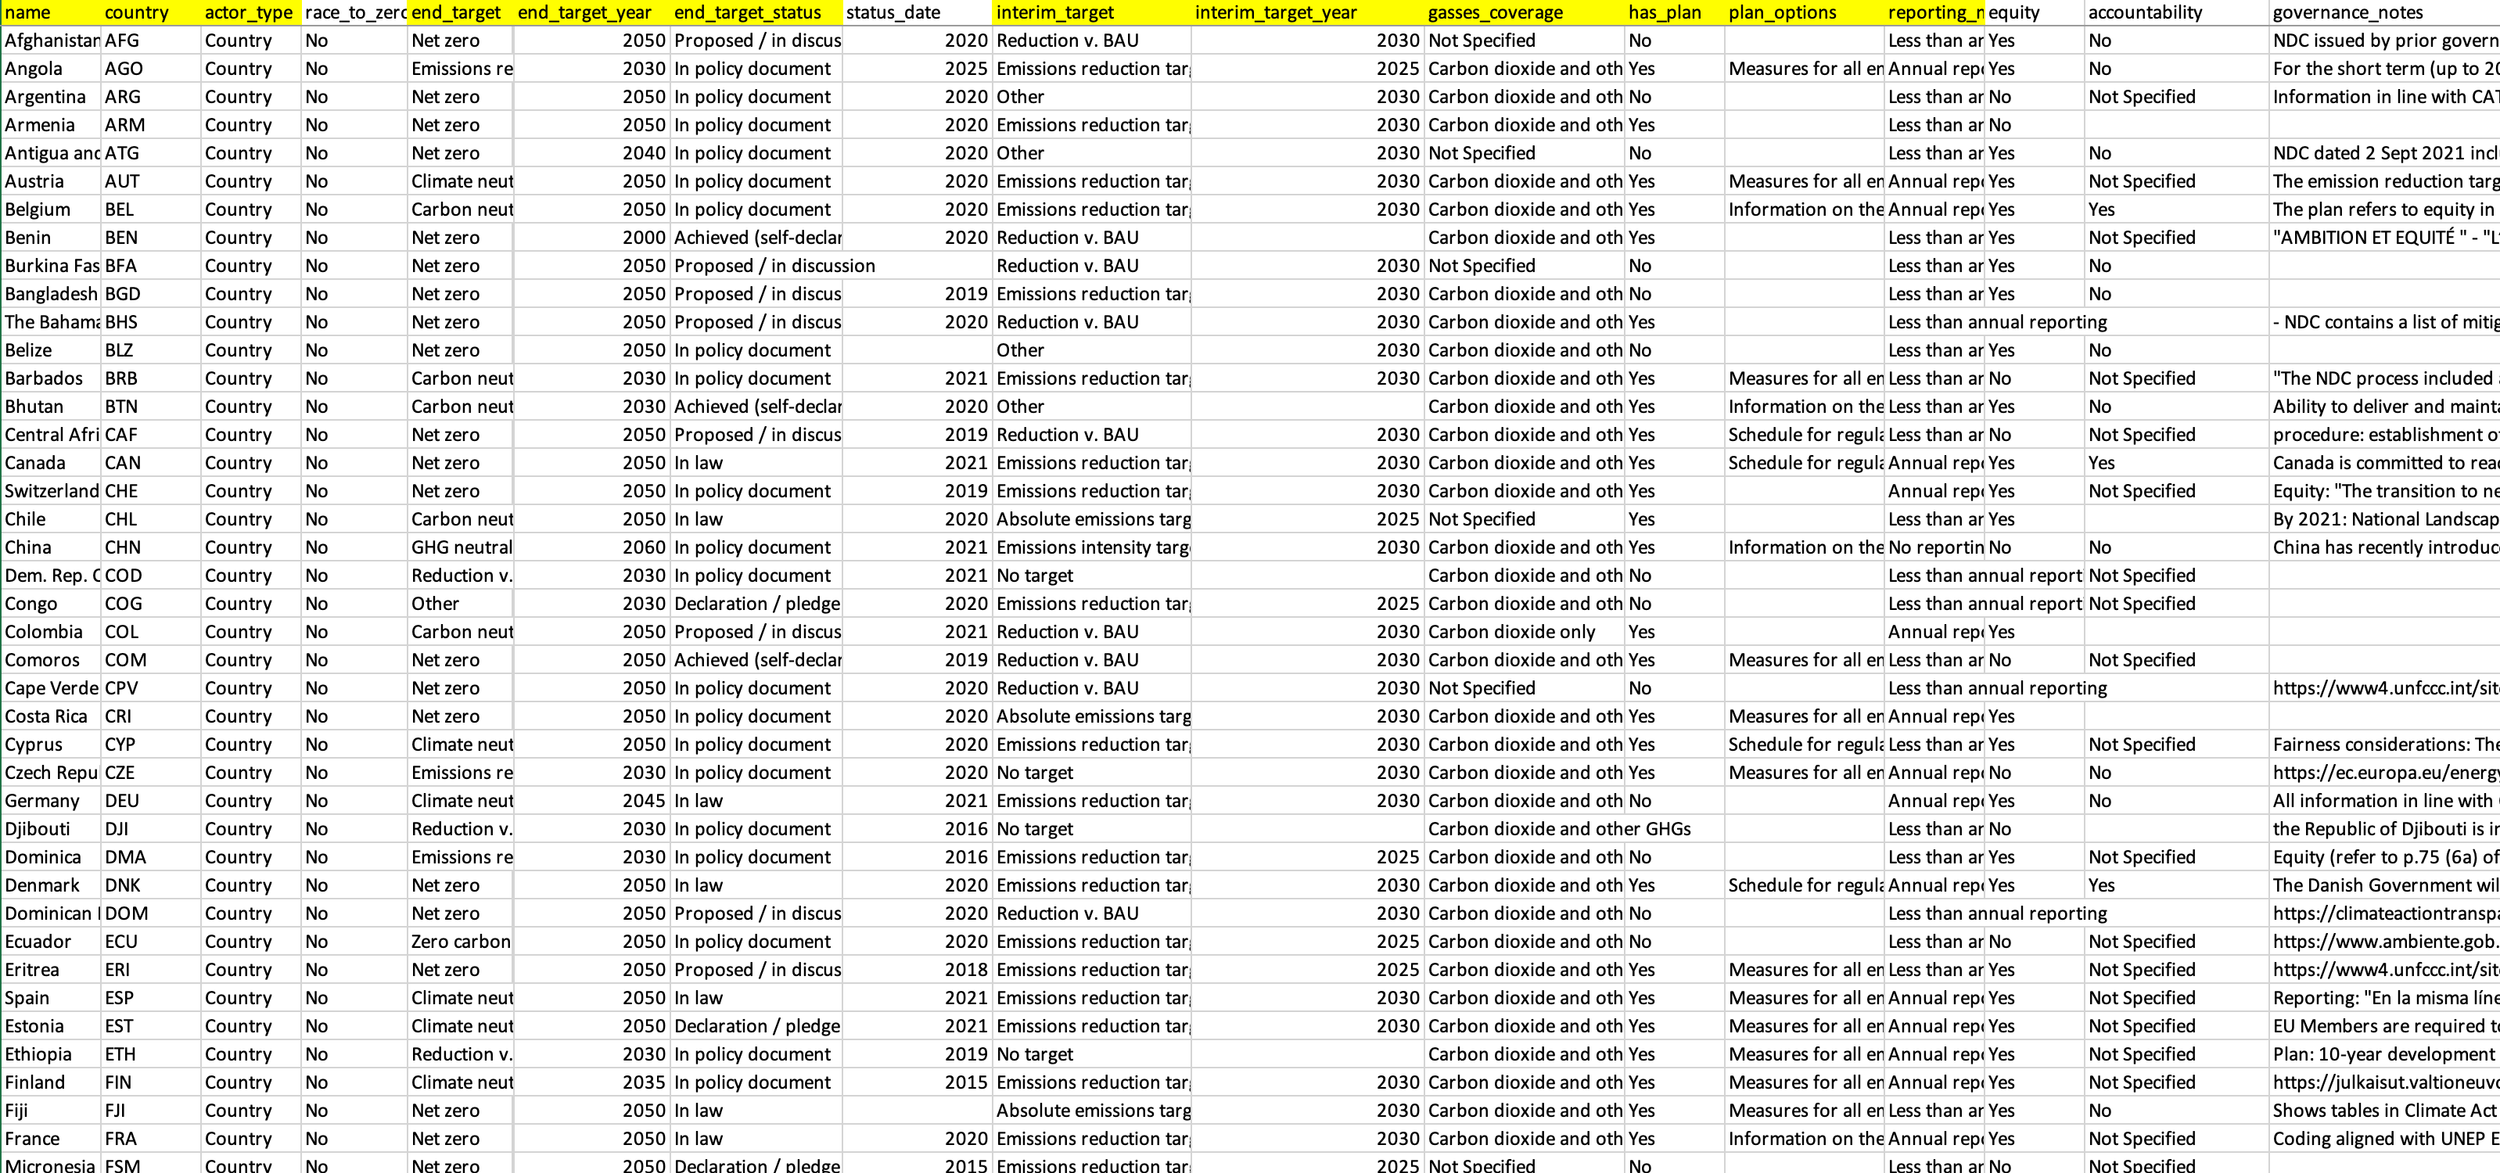
The visualisation presents Net Zero Pledges by countries showcasing data on targets set and factors that indicate the integrity of the targets. It focuses on top 80 countries based on annual GHG emissions 2019.
Data Gathering
The visualisation utilises Net Zero Tracker's dataset. The data was plotted, explored and analysed on MS excel and Flourish.


